

Rethinking traffic thresholds in wildlife-vehicle collision risk
Written by Johanna Heeres
September 7th, 2026
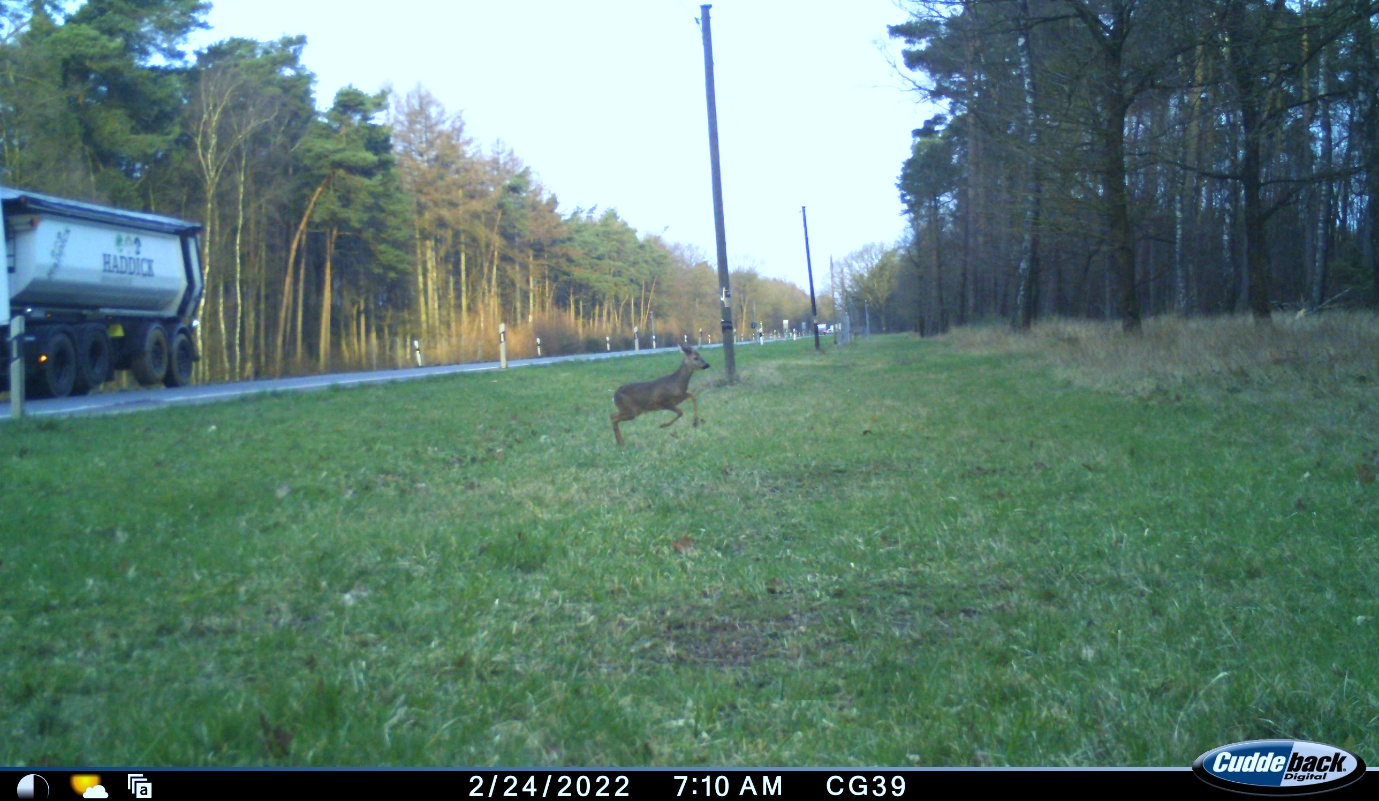
© Forstliche Versuchs- und Forschungsanstalt Baden-Württemberg
Wildlife–vehicle collisions (WVC) happen when animals cross roads while vehicles are passing. To estimate the risk of WVC, researchers have traditionally relied on static measures such as average daily traffic volume, vehicle speed or road type. However, these measures do not capture how traffic and animal activity changes throughout the day and across seasons.
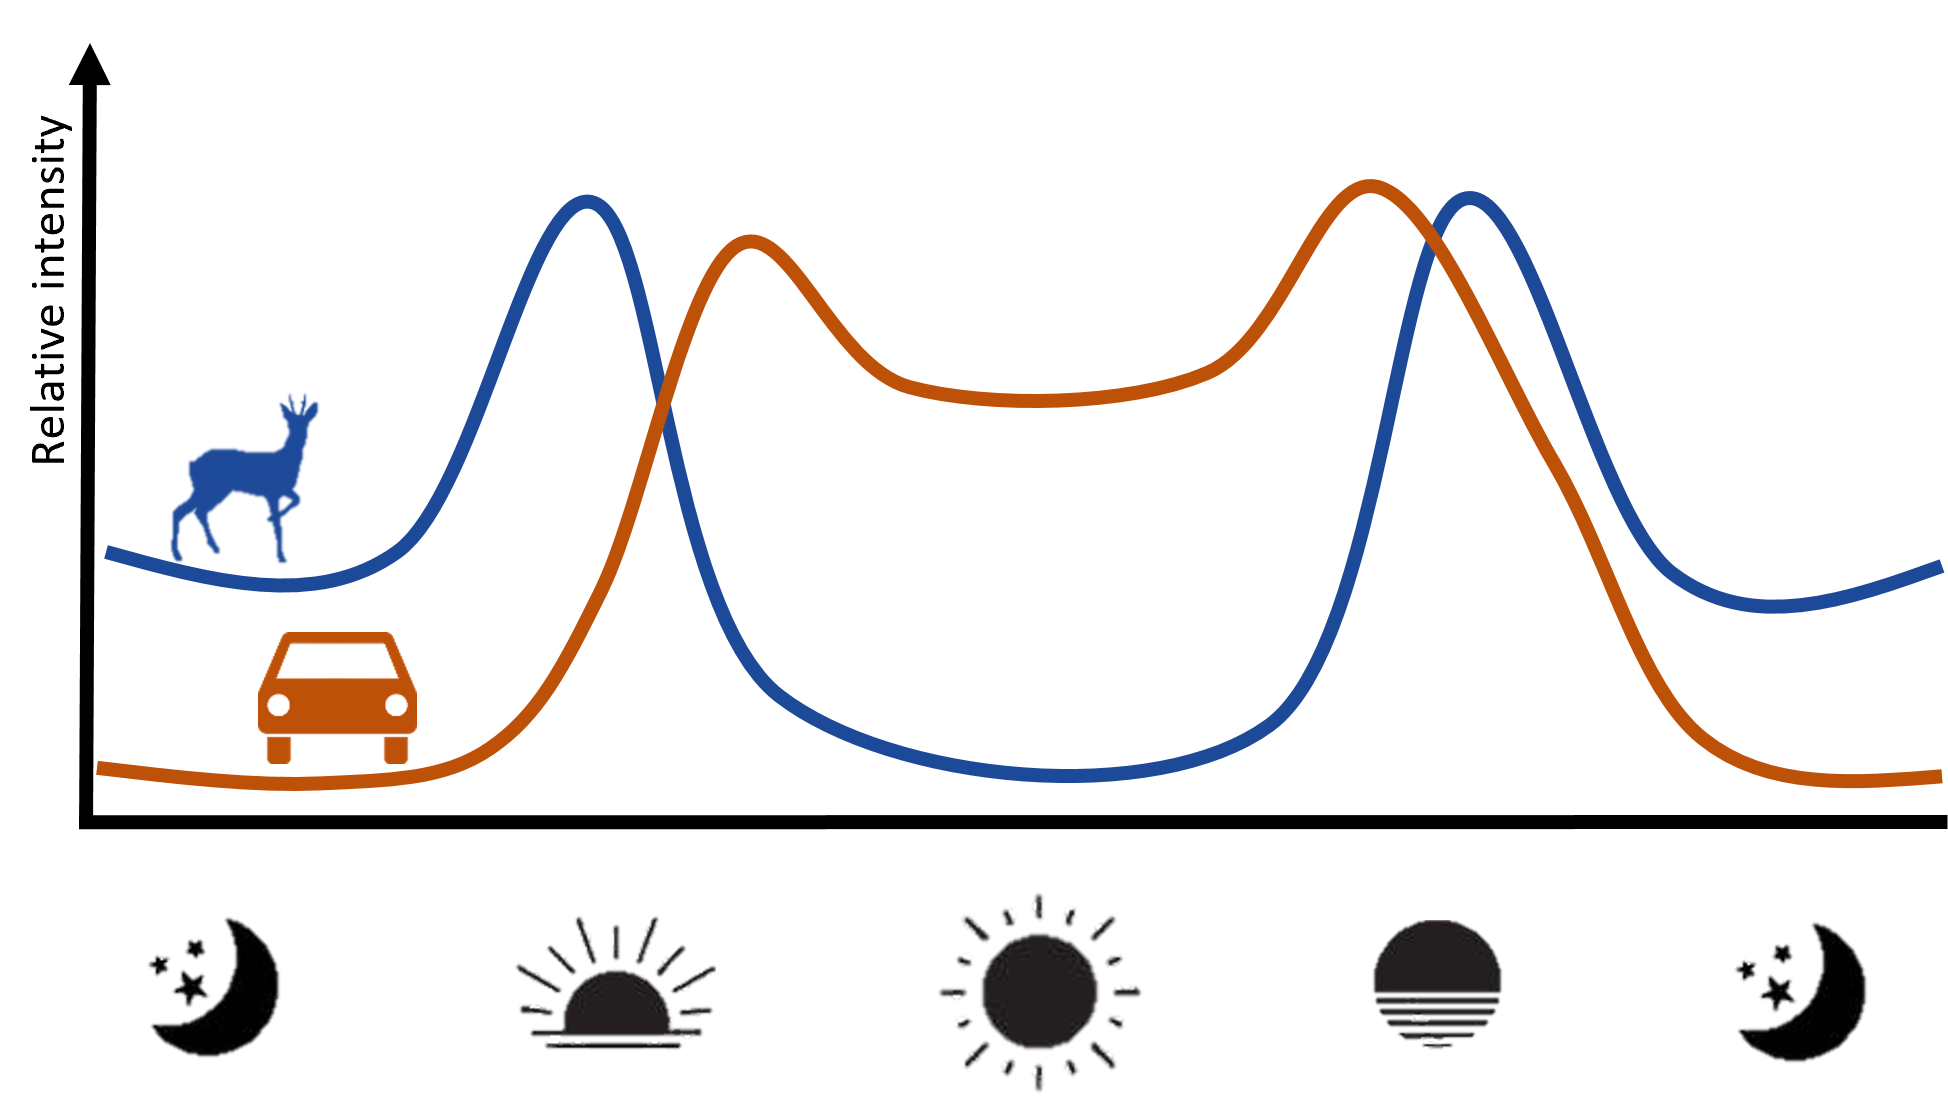
Figure 1: Visualization of the daily variation in the relative intensity of traffic volume (shown in orange) and crepuscular (peaks of activity at dawn and dusk) wildlife movement (shown in blue). Risk of WVC is highest when both peaks overlap.
People generally follow a schedule based on clock time, while wildlife activity is mainly influenced by daylight and seasonal changes. Because of these different rhythms, there are times when animal activity and traffic overlap strongly and times when they do not (Figure 1). As a result, collision risk is dynamic, rather than remaining the same throughout the day or year.
Describing traffic throughout the day
To better understand the daily changes of traffic, we used hourly traffic data from motorways, federal roads, and state roads across Germany and analysed how traffic is distributed throughout the day based on the month, time of day, road type and day of the week.
We used this data to create a predictable “daily traffic curve”, to estimate the number of vehicles on Germany’s roads at any hour, even when only average daily traffic data are available. For example, on 1 July between 7 and 8 AM, about 5.3% of a road's daily traffic is expected to be on the road. This means that a road carrying 30,000 vehicles per day would have roughly 1,500 vehicles during that hour, while a road carrying 2,000 vehicles per day would have about 100 vehicles.
Instead of using one value such as the average daily traffic volume or road type to estimate WVC risk, we can now use the hourly estimates of traffic volume. This “relative traffic intensity” can then be used to estimate changes in WVC risk over the day according to the traffic volume.
When is WVC risk highest?
To understand the relationship with WVC occurrence, we used a sample of collisions that occurred in 2024 in Germany. WVC occurrences were better explained by the relative traffic intensity, as predicted by the daily traffic curve, than by the actual number of vehicles on the road. This means, that both roads, one with 30,000 vehicles and one with 2,000 vehicles per day, have a comparably high risk for a WVC to happen at the same hourly proportion of daily traffic, even if the absolute number of vehicles on the road are very different. So, rather than an absolute traffic volume at which WVC risks always peak, the risk seems to be relative to the absolute traffic volume on that road.
Across all road types, WVC risk was highest during hours when less than 3% of the daily traffic volume was present (Figure 2). This may seem unexpected, as very few vehicles are on the road at these times. However, these periods usually occur around dawn, dusk, and at night, when many wildlife species are most active.
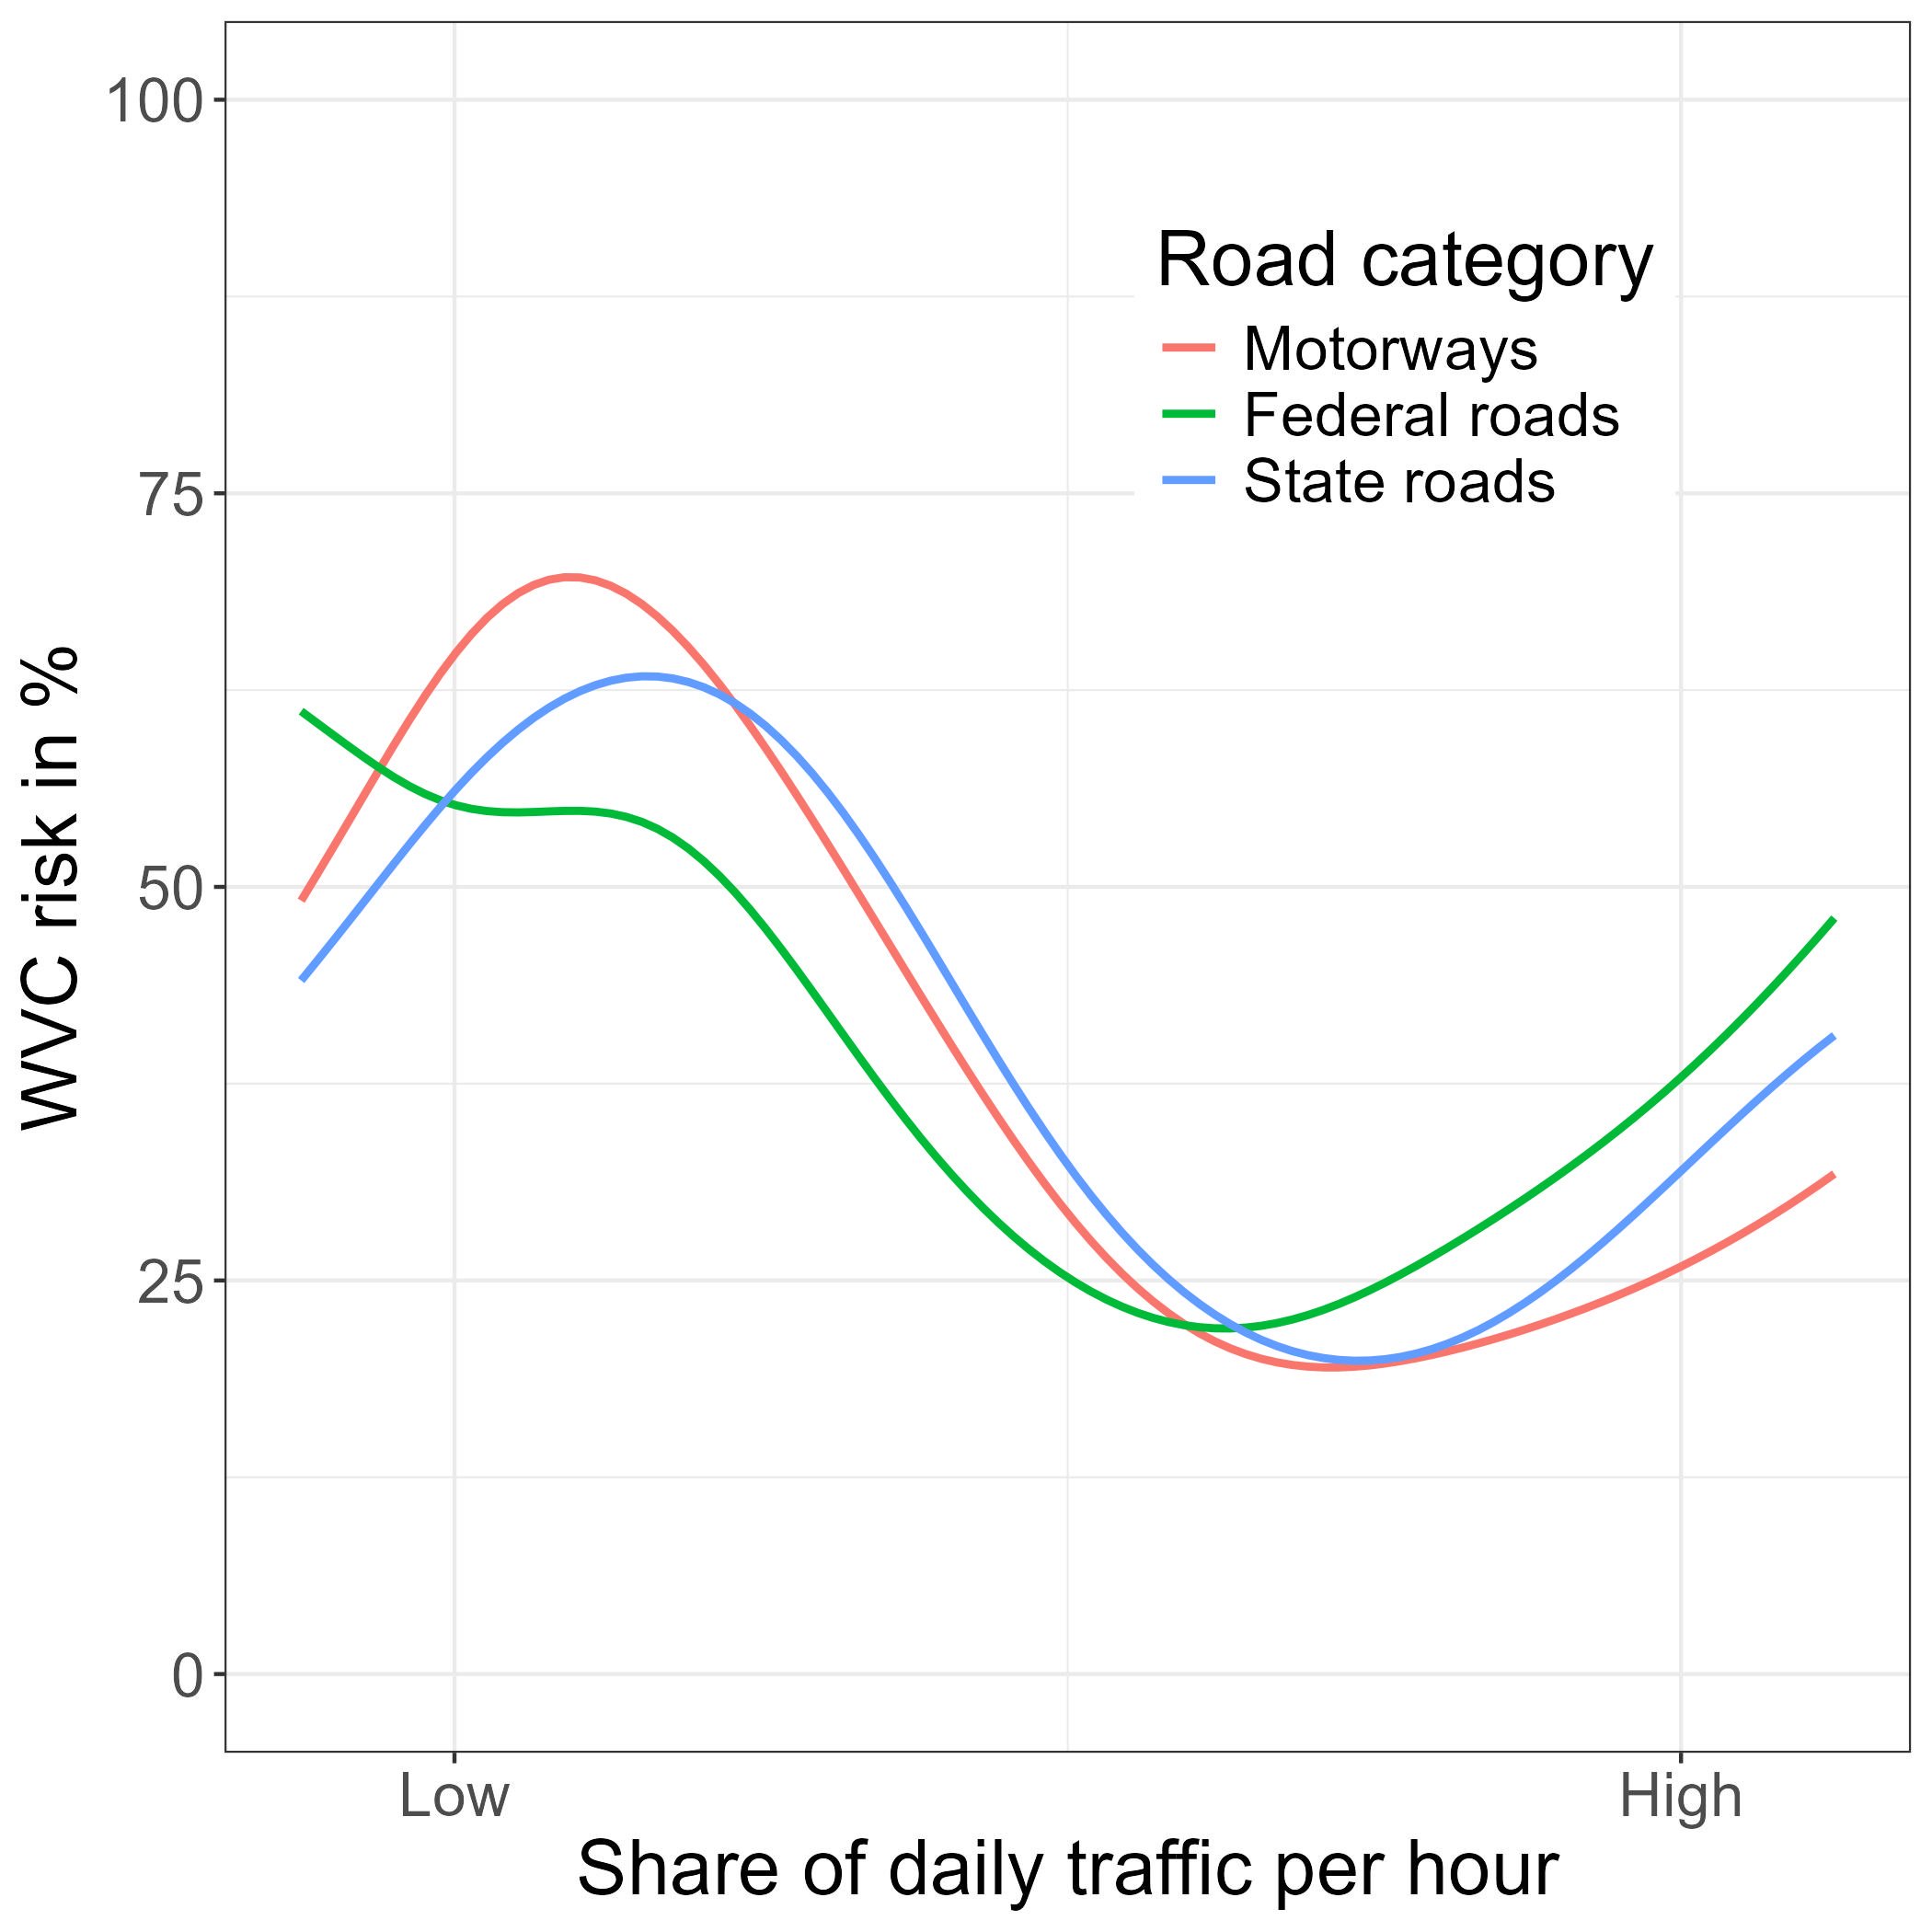
Figure 2: The relative traffic intensity, so the share of daily traffic per hour, describes the risk for a WVC to happen in %. Each line shows the response for three types of roads, which can have very different absolute daily traffic volumes.
This now raises the question: how can we improve WVC risk estimates with knowledge of animal activity patterns?
We know that during daylight hours, traffic volumes are typically high and wildlife movement is relatively low. At night, traffic decreases while animal movement increases. Seasonal changes also play an important role. In summer and winter in Germany, the peak activity periods of many animals often occur outside commuter traffic peaks, reducing the chance of collisions. In spring and autumn, however, dawn and dusk increasingly overlap with busy traffic periods, leading to a higher WVC risk. So, how do WVC numbers change as animal movement and commuter traffic times synchronize and desynchronize throughout the year?
Using daylight-saving time as a natural experiment
To better understand the relationship between traffic and increased wildlife activity during dawn and dusk, we used the biannual daylight-saving time (DST) changes as a natural experiment. DST shifts active commuter time because it is linked to clock-time, while wildlife activity remains linked to daylight. While this study was done in Germany, the same mechanism applies to the southern hemisphere.
After DST in spring, there is more traffic on the road at dawn and less at dusk– which coincided with increased rates of WVC around dawn and a decrease around dusk. In autumn, the opposite occurred: there is less traffic at dawn and more at dusk after DST has started, resulting in fewer WVC at dawn and more collisions at dusk (Figure 3). Thus, the constant movement of wildlife at dawn and dusk interacts with varying traffic intensity, which directly influences the number of collisions.
However, the relationship was not perfectly proportional. In spring, collisions increased more than expected, likely because wildlife activity also increases after winter. We also found greater variation in collision risk at dawn than at dusk within both seasons. We believe that this could be due to different movement behaviours in wildlife, such as the frequency of road crossings. Thus, traffic alone does not fully explain collision risk, which highlights the need to better understand additional factors influencing WVC risk estimates.
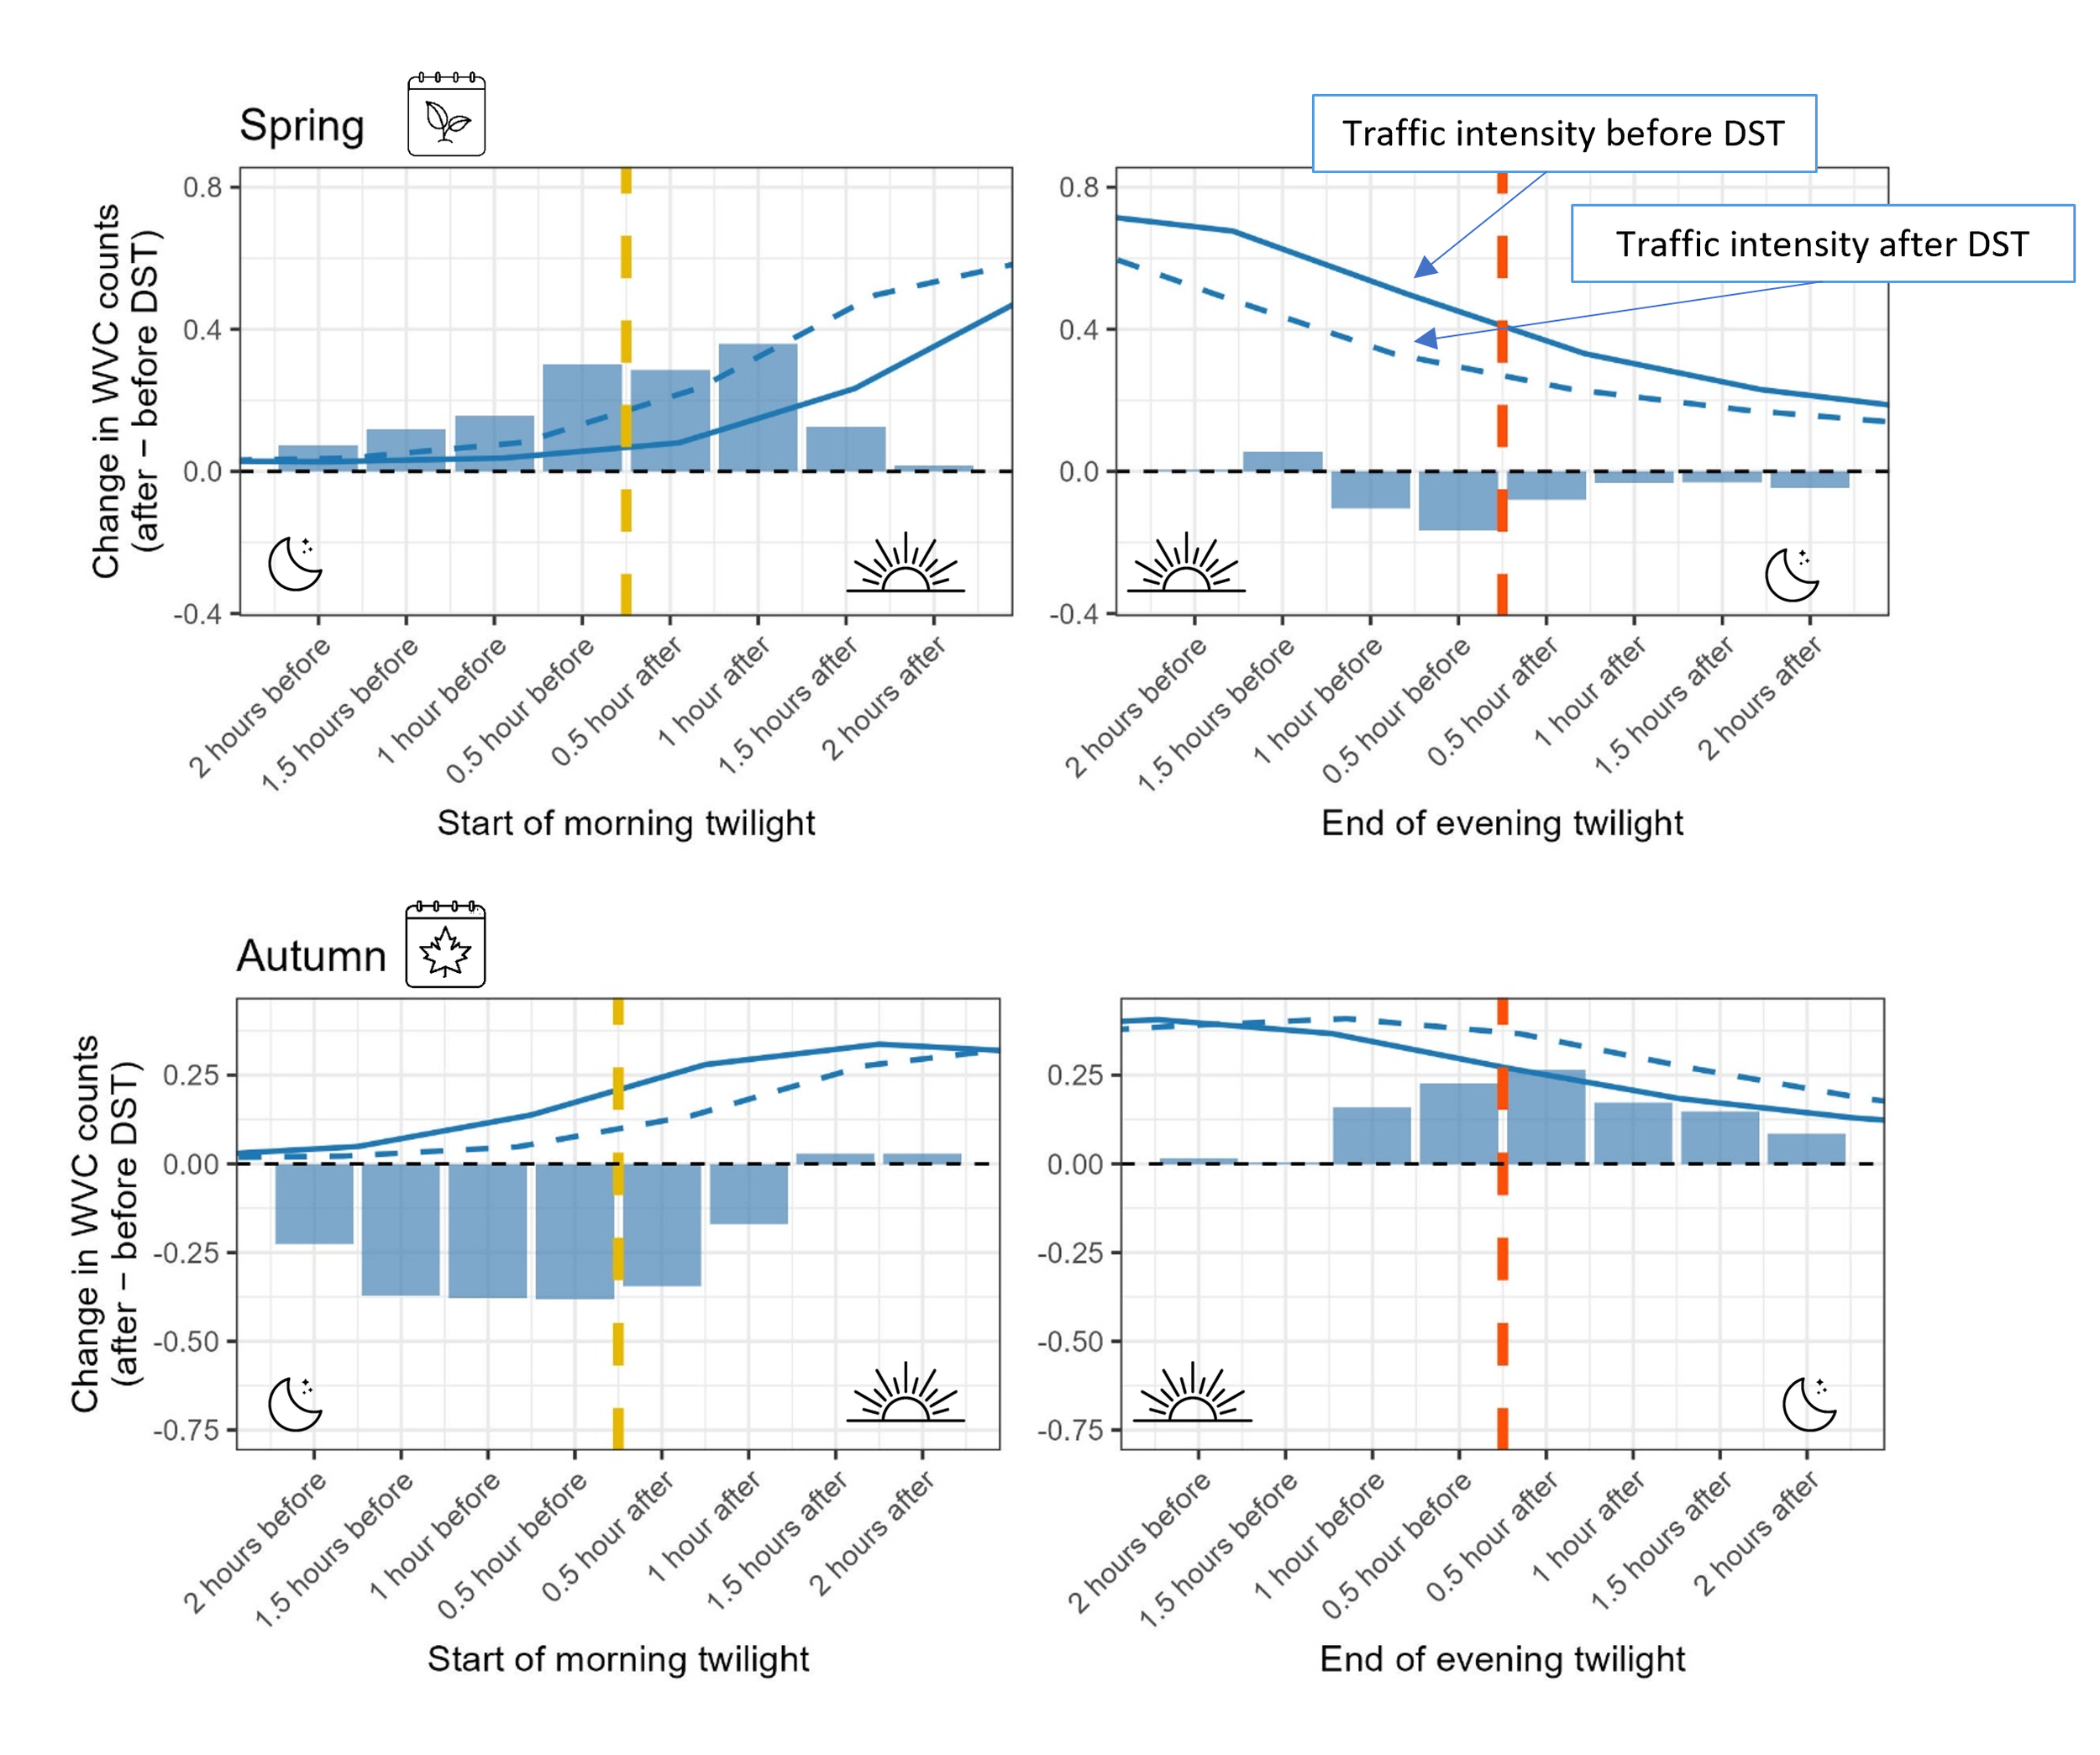
Figure 3: Change in the average number of WVC (blue bars) one week before to one week after DST (daylight savings time) for the two hours before and after the start of dawn (left; yellow dashed line) and the end of dusk (right; red dashed line) during spring (above) and autumn (below). The blue lines represent the predicted relative traffic intensity for the given time before (solid) and after (dashed) DST.
Collision risk depends on the overlap between human and wildlife activity
Our results show that there is no single traffic volume that makes a road either safe or dangerous for wildlife and motorists. Instead, collision risk changes throughout the day and year and depends largely on when human activity and wildlife activity overlap. A road that poses a high collision risk at dawn may present a much lower risk only a few hours later.
The daylight-savings time experiment demonstrated just how important this timing can be. When commuter traffic was suddenly shifted to dawn or dusk, collision rates changed almost immediately. Wildlife activity, however, seemed unchanged. This suggests that many animals continue to move linked to natural daylight cycles and attempt to cross roads at predictable times, while WVC risk changes depending on how traffic overlaps with those movements. In other words, understanding when animals attempt to cross roads may be just as important as understanding where they cross. Future studies combining wildlife movement data with fine-scale traffic information could help test this idea and improve the planning and evaluation of mitigation measures.
There is not one traffic threshold for WVC risk
These findings challenge the common view that roads have a fixed impact on wildlife. Instead, roads appear to function as dynamic barriers whose effects change throughout the day and across seasons. At some times, animals may be able to cross roads relatively easily, while at other times the same roads may become much more difficult or dangerous to cross. Understanding these changing conditions may help explain why wildlife sometimes continue to use roads despite high traffic levels and why collision hotspots can shift throughout the year.
This also has important implications for mitigation. Traditionally, efforts to reduce WVC have focused on identifying where collisions occur and installing measures such as fencing or wildlife crossing structures. While these measures remain essential, our results suggest that equal attention should be given to when collision risk is highest. Temporally targeted measures, such as dynamic warning signs, seasonal speed reductions, animal-detection systems, or app-based driver alerts, could focus specifically on periods when wildlife activity and traffic overlap most strongly. Such approaches may increase effectiveness while reducing unnecessary interventions during periods of lower risk. Together, these findings highlight the importance of considering both space and time when managing WVC. By viewing roads as dynamic rather than static barriers, managers can develop more adaptive strategies that improve safety for both wildlife and people.
Author information
Johanna Heeres, Researcher at the Forest Research Institute Baden-Württemberg and PhD student at Albert-Ludwigs University Freiburg/Germany, johanna@maertz.eu
Source citation
Heeres, J., Brieger, F. & Bhardwaj, M. (2025). A fine-scale analysis of the temporal patterns influencing wildlife-vehicle collision risk. Journal of Environmental Management 395:128002. 10.1016/j.jenvman.2025.128002
Heeres, J., Bhardwaj, M. & Brieger, F. (2026). Timing matters: shifts in traffic intensity impact the risk of wildlife-vehicle collisions. Transport Research Part D: Transport and Environment 159:105484. https://doi.org/10.1016/j.trd.2026.105484
Editor:
Rodney van der Ree
Cite this summary:
Heeres, J. (2026). Rethinking traffic thresholds in wildlife-vehicle collision risk. Edited by van der Ree, R. TransportEcology.info, Accessed at: https://transportecology.info/research/rethinking-traffic-thresholds